TIL | Clustering Code |
[ AI / ML ] 머신러닝 - 군집화 (Clustering) 실습
👩🏻💻 K-MOOC 실습으로 배우는 머신러닝 강의
📙 해당 포스트는 K-MOOC 강의 내용과 추가로 다른 자료들을 찾아 내용을 작성하였으며, 이론 및 개념에 대해 공부하고 예제 실습도 진행한 후 내용을 정리하였다.
군집화에 대한 이론을 보고 싶다면
👉 [ AI / ML ] 머신러닝 - 군집화 (Clustering) 여기로!
💻 실습 예제 코드
1. K-Means Clustering
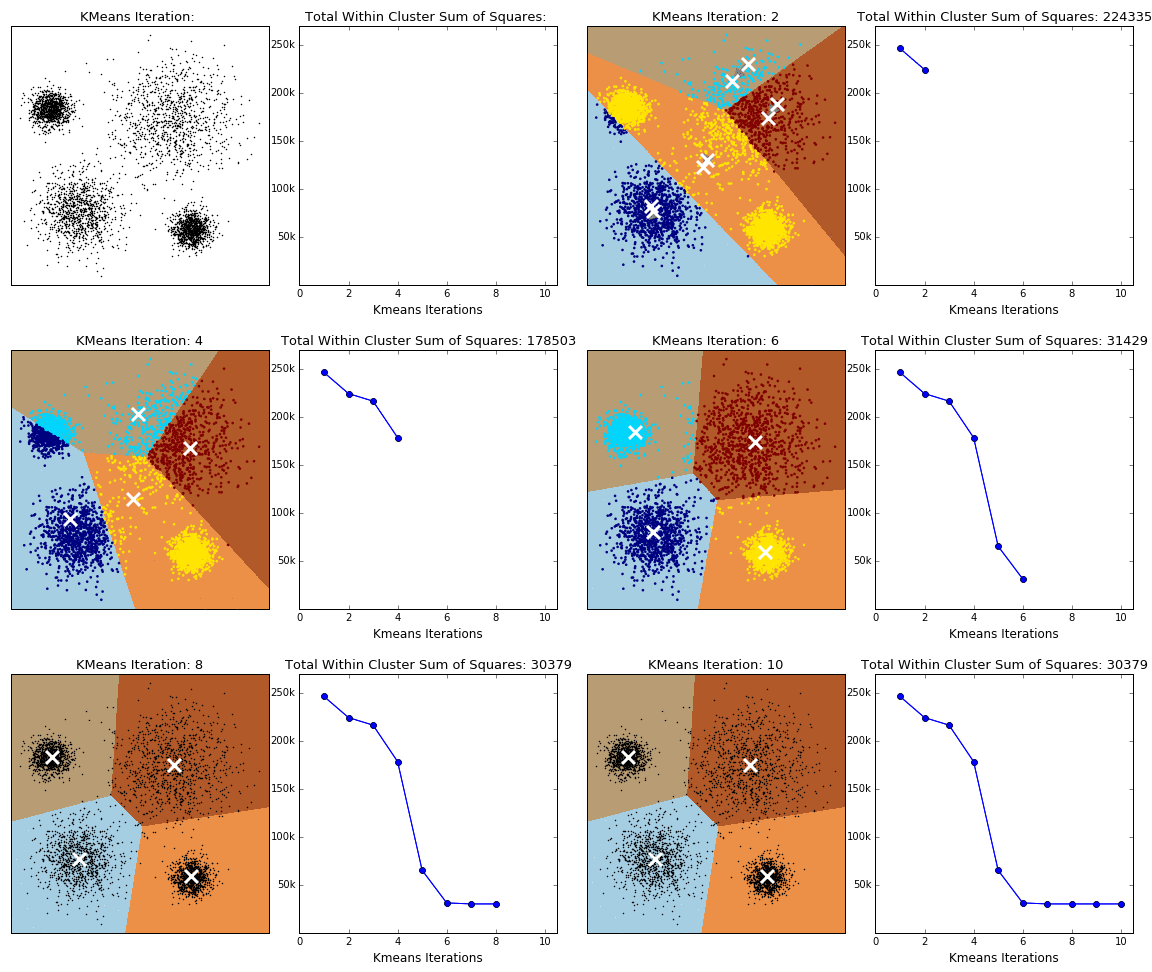
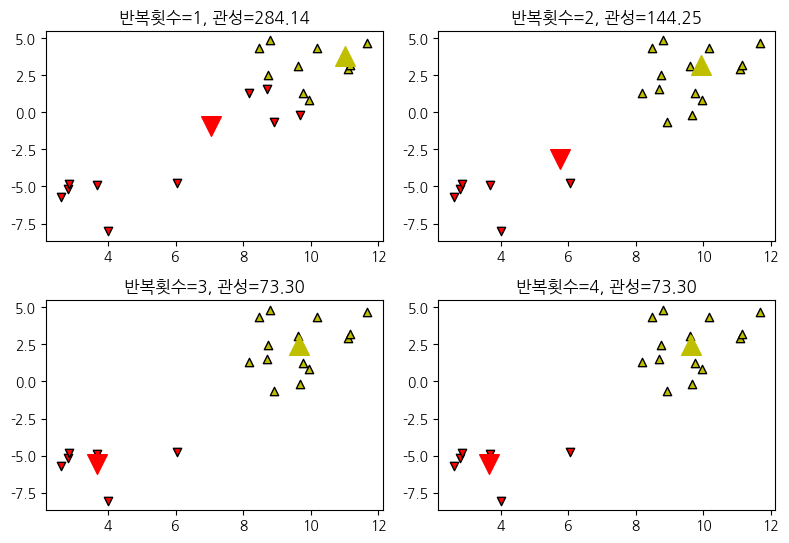
K-Means 군집화는 항상 수렴하지만 최종 군집화 결과가 전역 최적점이라는 보장은 없다. 군집화 결과는 초기 중심위치에 따라 달라질 수 있다.
from sklearn.datasets import make_blobs
from sklearn.cluster import KMeans

X, _ = make_blobs(n_samples=20, random_state=4)


def plot_KMeans(n):
    model = KMeans(n_clusters=2, init="random", n_init=1,
                   max_iter=n, random_state=6).fit(X)
    c0, c1 = model.cluster_centers_
    plt.scatter(X[model.labels_ == 0, 0], X[model.labels_ == 0, 1],
                marker='v', facecolor='r', edgecolors='k')
    plt.scatter(X[model.labels_ == 1, 0], X[model.labels_ == 1, 1],
                marker='^', facecolor='y', edgecolors='k')
    plt.scatter(c0[0], c0[1], marker='v', c="r", s=200)
    plt.scatter(c1[0], c1[1], marker='^', c="y", s=200)
    plt.grid(False)
    plt.title("반복횟수={}, 관성={:5.2f}".format(n, -model.score(X)))


plt.figure(figsize=(8, 8))
plt.subplot(321)
plot_KMeans(1)
plt.subplot(322)
plot_KMeans(2)
plt.subplot(323)
plot_KMeans(3)
plt.subplot(324)
plot_KMeans(4)
plt.tight_layout()
plt.show()
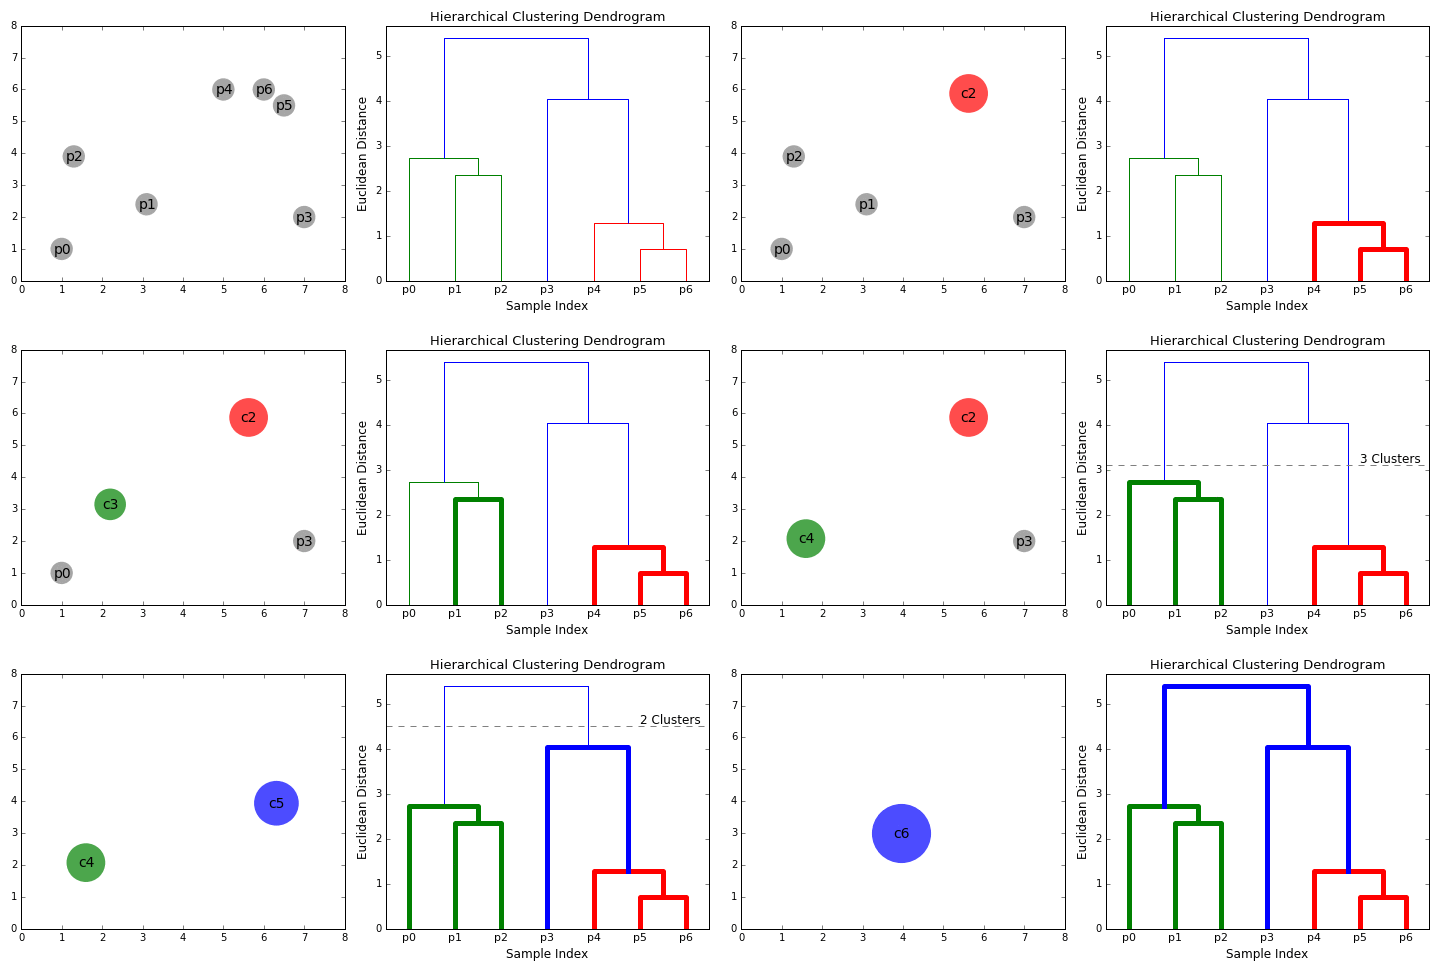
2. Hierarchical Clustering
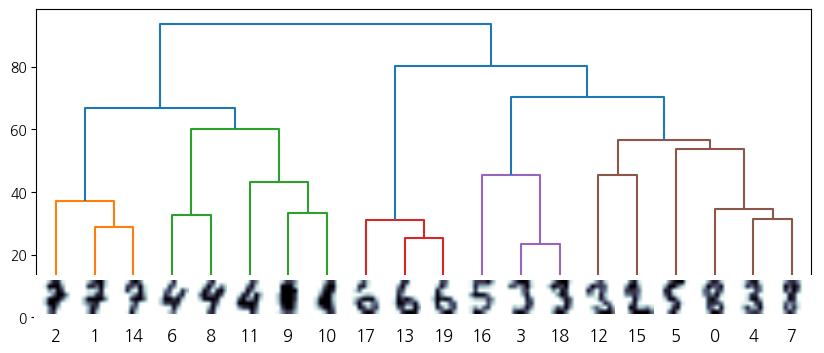
다음은 MNIST digit 이미지 중 20개의 이미지를 무작위로 골라 계층적 군집화를 적용해본 코드이다.
from sklearn.datasets import load_digits

digits = load_digits()
n_image = 20
np.random.seed(0)
idx = np.random.choice(range(len(digits.images)), n_image)
X = digits.data[idx]
images = digits.images[idx]

plt.figure(figsize=(12, 1))
for i in range(n_image):
    plt.subplot(1, n_image, i + 1)
    plt.imshow(images[i], cmap=plt.cm.bone)
    plt.grid(False)
    plt.xticks(())
    plt.yticks(())
    plt.title(i)

from scipy.cluster.hierarchy import linkage, dendrogram

Z = linkage(X, 'ward')
Z
array([[ 3.        , 18.        , 23.51595203,  2.        ],
       [13.        , 19.        , 25.27844932,  2.        ],
       [ 1.        , 14.        , 28.67054237,  2.        ],
       [17.        , 21.        , 31.04298096,  3.        ],
       [ 4.        ,  7.        , 31.51190251,  2.        ],
       [ 6.        ,  8.        , 32.54228019,  2.        ],
       [ 9.        , 10.        , 33.36165464,  2.        ],
       [ 0.        , 24.        , 34.51086785,  3.        ],
       [ 2.        , 22.        , 37.03151811,  3.        ],
       [11.        , 26.        , 43.25505751,  3.        ],
       [12.        , 15.        , 45.31004304,  2.        ],
       [16.        , 20.        , 45.36151085,  3.        ],
       [ 5.        , 27.        , 53.54437412,  4.        ],
       [30.        , 32.        , 56.6892112 ,  6.        ],
       [25.        , 29.        , 60.16809786,  5.        ],
       [28.        , 34.        , 66.61618922,  8.        ],
       [31.        , 33.        , 70.35228813,  9.        ],
       [23.        , 36.        , 80.11172754, 12.        ],
       [35.        , 37.        , 93.57946712, 20.        ]])
from matplotlib.offsetbox import OffsetImage, AnnotationBbox

plt.figure(figsize=(10, 4))
ax = plt.subplot()

ddata = dendrogram(Z)

dcoord = np.array(ddata["dcoord"])
icoord = np.array(ddata["icoord"])
leaves = np.array(ddata["leaves"])
idx = np.argsort(dcoord[:, 2])
dcoord = dcoord[idx, :]
icoord = icoord[idx, :]
idx = np.argsort(Z[:, :2].ravel())
label_pos = icoord[:, 1:3].ravel()[idx][:20]

for i in range(20):
    imagebox = OffsetImage(images[i], cmap=plt.cm.bone_r, interpolation="bilinear", zoom=3)
    ab = AnnotationBbox(imagebox, (label_pos[i], 0),  box_alignment=(0.5, -0.1),
                        bboxprops={"edgecolor" : "none"})
    ax.add_artist(ab)

plt.show()
3. DBSCAN Clustering
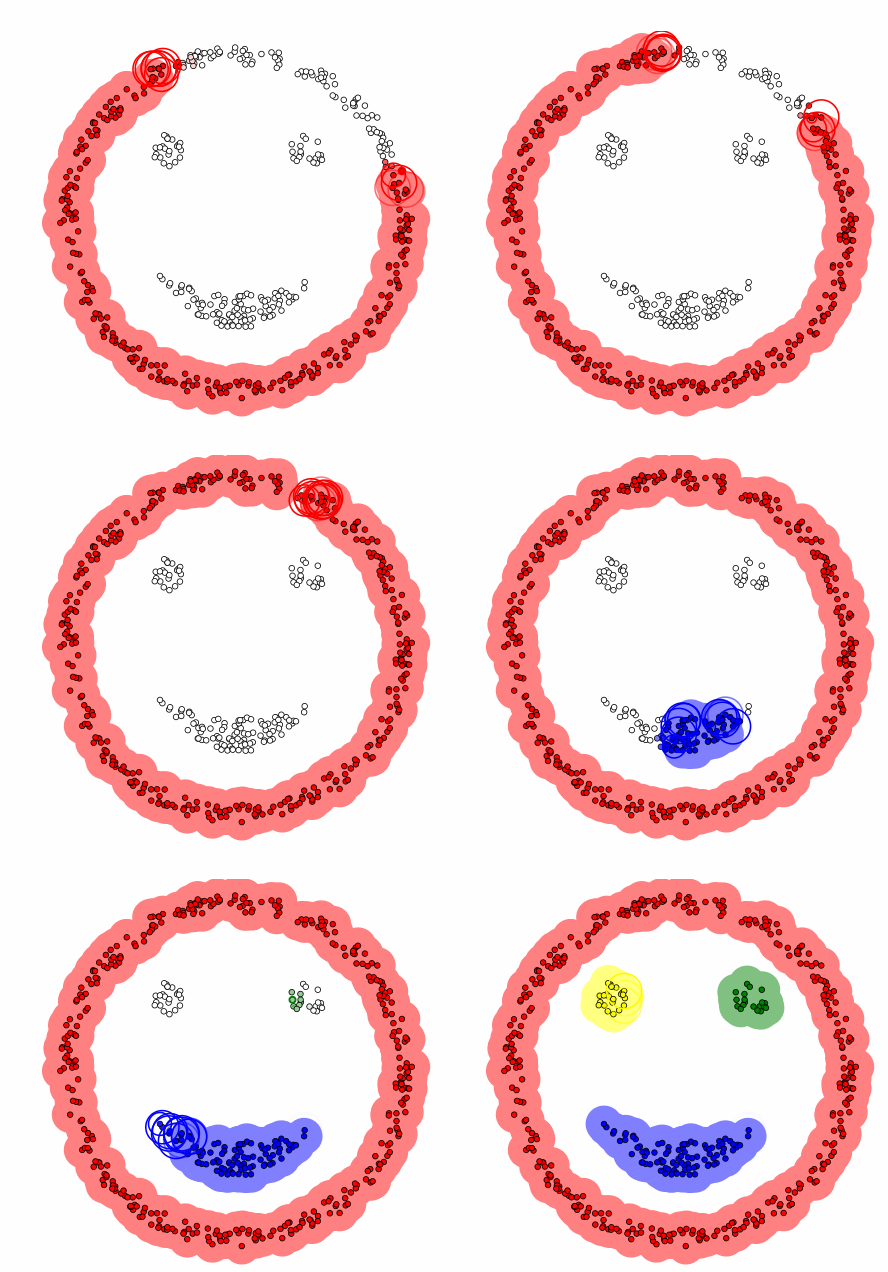
sklearn의 cluster 서브패키지는 DBSCAN 군집화를 위한 DBSCAN 클래스를 제공한다.
[Parmaeters]
eps: epsilon- 이웃을 정의하기 위한 거리
min_samples: 핵심 데이터를 정의하기 위해 필요한 이웃 영역 안의 데이터 개수
[Attributes]
labels: 군집 번호.- 아웃라이어는 -1 값을 가진다.
core_sample_indices_: 핵심 데이터의 인덱스.- 여기에 포함되지 않고 아웃라이어도 아닌 데이터는 경계 데이터다.
다음은 make_circles 명령과 make_moons 명령으로 만든 동심원, 초승달 데이터를 디비스캔으로 군집화한 결과를 나타낸 것이다. 마커(marker)의 모양은 군집을 나타내고 마커의 크기가 큰 데이터는 핵심데이터, x 표시된 데이터는 outlier다.
from sklearn.datasets import make_circles, make_moons
from sklearn.cluster import DBSCAN

n_samples = 1000
np.random.seed(2)
X1, y1 = make_circles(n_samples=n_samples, factor=.5, noise=.09)
X2, y2 = make_moons(n_samples=n_samples, noise=.1)

def plot_DBSCAN(title, X, eps, xlim, ylim):
    model = DBSCAN(eps=eps)
    y_pred = model.fit_predict(X)
    idx_outlier = model.labels_ == -1
    plt.scatter(X[idx_outlier, 0], X[idx_outlier, 1], marker='x', lw=1, s=20)
    plt.scatter(X[model.labels_ == 0, 0], X[model.labels_ == 0, 1], marker='o', facecolor='g', s=5)
    plt.scatter(X[model.labels_ == 1, 0], X[model.labels_ == 1, 1], marker='s', facecolor='y', s=5)
    X_core = X[model.core_sample_indices_, :]
    idx_core_0 = np.array(list(set(np.where(model.labels_ == 0)[0]).intersection(model.core_sample_indices_)))
    idx_core_1 = np.array(list(set(np.where(model.labels_ == 1)[0]).intersection(model.core_sample_indices_)))
    plt.scatter(X[idx_core_0, 0], X[idx_core_0, 1], marker='o', facecolor='g', s=80, alpha=0.3)
    plt.scatter(X[idx_core_1, 0], X[idx_core_1, 1], marker='s', facecolor='y', s=80, alpha=0.3)
    plt.grid(False)
    plt.xlim(*xlim)
    plt.ylim(*ylim)
    plt.xticks(())
    plt.yticks(())
    plt.title(title)
    return y_pred

plt.figure(figsize=(10, 5))
plt.subplot(121)
y_pred1 = plot_DBSCAN("동심원 군집", X1, 0.1, (-1.2, 1.2), (-1.2, 1.2))
plt.subplot(122)
y_pred2 = plot_DBSCAN("초승달 군집", X2, 0.1, (-1.5, 2.5), (-0.8, 1.2))
plt.tight_layout()
plt.show()
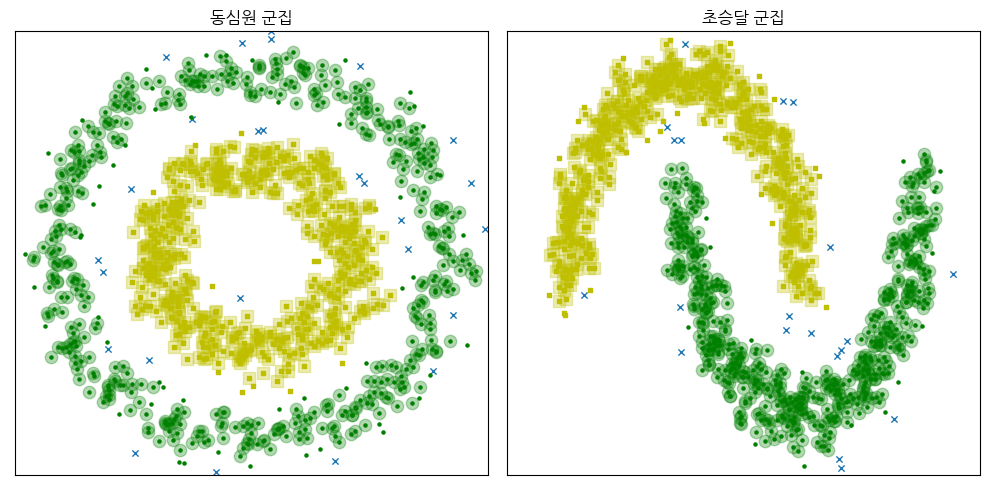
군집화 결과의 ARI와 AMI의 값을 알고 싶다면 다음 코드를 참고하자.
from sklearn.metrics.cluster import adjusted_mutual_info_score, adjusted_rand_score

print("동심원 군집 ARI:", adjusted_rand_score(y1, y_pred1))
print("동심원 군집 AMI:", adjusted_mutual_info_score(y1, y_pred1))
print("초승달 군집 ARI:", adjusted_rand_score(y2, y_pred2))
print("초승달 군집 AMI:", adjusted_mutual_info_score(y2, y_pred2))
동심원 군집 ARI: 0.9414262371038592
동심원 군집 AMI: 0.8967648464619999
초승달 군집 ARI: 0.9544844153926417
초승달 군집 AMI: 0.9151495815452475
마무리하면서..
다음 포스트에서 만나요 🙌
참고
Related Posts
| TIL | LeakGAN이란? - NLP Text Generation Model | |
| TIL | GAN - NLP Text Generation Model | |
|
TIL | Logistic Regression | 로지스틱 회귀란? |
💙 You need to log in to GitHub to write comments. 💙
If you can't see comments, please refresh page(F5).